INTRODUCTION
1.1 Background
Mathematics multiple choice test is a form of mathematics assessment in which respondents are asked to select the best possible answer (or answers) out of the choices from a list. The multiple choice format is most frequently used in educational testing. Multiple choice tests are used more and more as comprehensive examinations at the end of an academic session. They may be used to identify strengths and weaknesses in students as well as to provide feedback to teachers on their educational actions. The purposes in which the test questions are prepared and put together to form an examination, and the procedure for scoring, analyzing and reporting the results, all have a bearing upon the conclusions drawn from the performance of the individuals and groups tested.
An item analysis is recommended for any multiple choice testing purposes. Item analysis is a process which examines student responses to individual test items (questions) in order to assess the quality of those items and of the test as a whole. Item analysis is especially valuable in improving items which will be used again in later tests, but it can also be used to eliminate ambiguous or misleading items in a single test administration. In addition, item analysis is valuable for increasing instructors' skills in test construction, and identifying specific areas of course content which need greater emphasis or clarity.
This report provides the teacher with an in-depth look at how well each of the choices on an item functioned and how well each item contributed to the overall estimation of the students’ mathematics-related learning because normally there are too many different scores in the range to provide a view of the performance of each of the choices to the item. An item analysis is typically done using the total score as the criterion for effectiveness of the individual items. The intent of the item analysis is to provide a picture of how well students at each score level performed on a test item.
Item analysis is composed of several numerical values which we call item statistics. Item difficulty is defined as the proportion selecting the correct alternative. If the purpose of the test is to discriminate among students, then items of middle or medium difficulty should be used. Items of medium difficulty or slightly higher will tend to do a better job of discriminating between students and will also tend to work together to provide a higher test reliability.
Test items should also discriminate between the high groups and the low groups. For tests designed to rank order (or discriminate between) students, two things should be kept in mind when evaluating the incorrect choices to an item: (1) each choice should attract at least some of the students and (2) each should attract more students from the lower groups than from the higher ones. If this were not the case, then an item is probably not a good one for discriminating among students.
1.2 Rationale
Item analysis is an important and necessary step in the preparation of good multiple choice test. Because of this fact it is suggested that every classroom teacher who uses multiple choice test data should know item analysis, how it is and what it means.
In this project, we want to determine whether an item functions as teacher intended, gives feed back to teachers about the students’ performance and as a basis for class discussion, gives feedback about students’ difficulties and gives information about revising and improving test items.
Using the item analysis, we also want to get a clear picture of how well students at each score level performed on a test item. Since the test items could discriminate between the high groups and the low groups, we also want to evaluate whether there is any incorrect choices to the certain item. We want to find out which question had the largest number of correct responses and which one had the lowest. It considers not only the results from students but also the possibility that questions need to be revised in order to get at the true assessment of learning for that outcome and scrutinize any question that more than half of the students answered incorrectly.
1.3 Definition of Terms
1.3.1 Assessment
Assessment consists of taking samples of behavior at a given point in time and estimating the worth of those behaviors. Thus the underlying assumption of assessment is that it provides a representative sample of behavior of the student being assessed. On the basis of the kind of sample taken inferences are made about the students' achievements. All forms of assessment provide estimates of the students’ current status.
1.3.2. Mathematics Multiple Choice Test
Mathematics Multiple Choice Test is an assessment administered on the computer, intended to measure the student knowledge and skills in many mathematics topics. It is a form of mathematics assessment in which students are asked to select the best possible answer out of the choices from a list. This test contains multiple choice items consist of a stem and a set of options. The stem is the beginning part of the item that presents the item as a question or problem to be solved by the student. The stem ends with a lead-in question explaining how the respondent must answer. The options are the possible answers that the students can choose. The correct answer called the key and the incorrect answers called distracters. Only one answer can be keyed as correct. The correct response to an item is awarded 1 mark, while an incorrect response is given 0 marks. A correct answer earns a set number of points toward the total mark.
1.3.3. The Test Analysis Program (TAP) Software
The Test Analysis Program (TAP) is the software which is designed as a powerful and easy-to-use test analysis package. The TAP version used in this project is 6.65. As a test analysis package, the user can insert test score data in text format or enter test data directly into the program. For teaching purposes, TAP generates sample sets of test data. The user can set various parameters for the sample data, including the difficulty of the test, number of scores, number of test items and number of possible answers per item. TAP output provides examinee analysis that includes percentage correct, letter grade and confidence intervals for each student and aggregate descriptive statistics for the group. TAP also generates the teacher’s list of scores and wrong answers by student, as well as a report for each student indicating his or her score, responses to each item and the correct answers to items missed. Item and Test Analysis, includes item difficulty, point biserial, discrimination index and various statistics if item deleted (KR20, scale mean and standard deviation, etc.). TAP also calculates the number of additional items needed to increase reliability. It also provides an Options Analysis includes high group and low group item difficulty for correct answer and distracters.
LITERATURE REVIEW
Multiple choice tests can be used to meet a variety of
educational purposes, though they most often are used in the classroom to
measure academic achievement. Other purposes to which they can be put include
feedback to students, instructional feedback, diagnosis of student
misconceptions, and others. Such a test usually consists of a number of items
that pose a question to which students must select an answer from among a
number of choices. Items can also be statements to which students must find the
best completion. Multiple-choice items, therefore, are fundamentally
recognition tasks, where students must identify the correct response.
The
rules of test development, then, work in fundamentally two ways; to maximize
the potential for the student to show you what they know about the content, and
to minimize the possibility that other factors will influence the score. Such
factors range from test forms that are hard to read and navigate to fatigue to
reading ability or computer literacy. In writing items, we must eliminate
"guessing" and "trick" questions. In test layout, that
means avoiding student confusion about how to complete the test.
Once we have administered the test, it is possible to conduct several analyses to ensure the quality of the questions for both this and future administrations of the test. There are essentially two kinds of analysis possible with multiple choice questions. The first kind of analysis, scoring models, deals with scoring the test to determine student performance. The second kind of analysis, item analysis, deals with analyzing how well each test item functioned.
It is important for teachers to highlight ways in which different representations of the same data can convey different information and to emphasize the importance of selecting representations suited to the particular mathematical tasks at hand.
Data can be shown in a variety of ways including graphs, charts, tables and, Stem and Leaf Plot. A Stem and Leaf Plot is a type of graph that is similar to a histogram but shows more information. It is a good choice when the data sets are small. The stem plot is a quick way to graph and gives an exact picture of the data.
The Stem-and-Leaf Plot summarizes the shape of a set of data (the distribution) and provides extra detail regarding individual values. The data is arranged by
place value.
The digit in the largest place is referred to as the stem and the digits in the smallest place are referred to as the leaf (leaves). The leaves are always displayed to the left of the stem. Stem and Leaf Plots are great organizers for large amounts of information.
Occasionally statisticians will quote a normal distribution not only in terms of the mean and the standard deviation, but also as a confidence interval of a certain percentage. Usually, the percentage that they choose is 95%, but that's only a tradition and we can have a 99% confidence interval, a 90% confidence interval or an interval of any other percentage, if we want.
|
|
In Figure 1, 95% confidence interval is a range of values, centered around the mean, which contains 95% of the items in the entire population. It is the shaded region on the diagram. It is normally quoted using the two values at the left and right end of the region. 95% of the entire curve is shaded, and 5% is left unshaded (the two "tails" on the right and left sides of the diagram).
|
Since the region has the mean at its centre, it must be symmetrical, and there must be 2.5% unshaded at each end of the diagram. The end values of the 95% confidence interval are found easily by multiplying the standard deviation by a critical number, which has the value 1.96. This gives the distance from the mean of each of the end values. The lower limit is found by subtracting this distance from the mean, the upper limit by adding the distance to the mean.
Item Difficulty shows how hard or easy was the item for a particular group of students. This is typically computed as the proportion of students who got the item correct. So a low value means a hard question and a high value means an easy question on a scale from 0.00 to 1.00. It is best to have a mix of difficulties: some hard ones to challenge top students; some easy ones so low-performing students will persist; and the bulk of items at a moderate difficulty level. The average item difficulty across a test, for most multiple-choice types, should be between 0.6 and 0.7 (Gronlund & Linn, 1990).
Item Discrimination shows how well does the item differentiate among students who have mastered the content and students who have not. This is calculated either as a correlation coefficient between the item score and the total score or as a proportion of high-scoring student who got the item right to low-scoring students who got the item right. Either way, it is expressed on a scale from -1.00 to +1.00. Negative 1 means all low scorers got the item right and all high scorers got the item wrong. Given that we want students who have mastered the content getting each item correct, that's bad. A positive 1 means the item worked exactly as it should. A zero means the item doesn't distinguish between mastery and non-mastery students. That is also bad. There are a number of statistical issues at work that cause +1.00 to be a rare occurrence, so that a reasonable expectation for item discrimination indices is between 0.3 and 0.5 (Oosterhof, 2001). Again, a mix of different values in an exam is acceptable.
Option Analysis is an approach to see who is choosing each option for an item. Usually the examinees are divided into low-scoring and high-scoring groups, and the proportion of each choosing each option is reported. High-scoring students will usually pick the correct response and low scoring students will usually pick a distracter. If the opposite happens, that's a cue to revise the item. Something about a distracter is attracting high performance students (Oosterhof, 2001).
One final statistic that is useful is the reliability coefficient. Reliability is the degree of accuracy present in the score. For multiple-choice tests, this is indexed using a reliability coefficient like Cronbach's Alpha or KR-21. Both range from 0.00 to 1.00 with higher values indicating higher reliability. Though there are not strict cutoffs for "acceptable" reliability coefficients because reliability is influenced by many diverse factors, the consensus in the measurement field is that 0.60 or 0.70 would be an acceptable lower value (Oosterhof, 2001). Having most item discrimination values at or near 0.50, having a variety of item difficulties and having more items will all increase estimates of reliability (Gronlund, 1988; Nitko, 2001; Oosterhof, 2001).
The standard error of the mean (SEM) quantifies the precision of the mean. It is a measure of how far your sample mean is likely to be from the true population mean. It is expressed in the same units as the data. The SEM is always smaller than the SD. With large samples, the SEM is much smaller than the SD.
Design & Development
3.1 Assessment Tools
Twenty (20) items multiple choice test was designed to cover the area of Numbers, Shape and Space, and Relationship. In this test, the understanding of numbers enables pupils to make calculations and estimates, and analyze and solve related problems. This area is a continuation of the primary school mathematics curriculum. The topic tested in Numbers’ area is Standard Form. Shape and space is an important area or component in the secondary school mathematics curriculum to helps students to effectively solve problems in geometry. At the same time, pupils can also improve their visual skills and appreciate the aesthetic value of shapes and space topics on algebra and geometry. Therefore, the handling of relationships such as recognizing a formula or a law and making generalizations of a situation becomes a basic necessity. The topics tested in Shape and Space’s area are Lines and Angles, and Polygons. In Relationship’s area, the students are tested about how to express a formula, an equation or an inequality. The topics tested are Algebraic Expression, Algebraic Formulae, Linear Inequalities, Quadratic Expressions and Equations, and Sets.
The test contains 20 questions drawn from various topics that they have already learned and all questions were made using the web application WUFOO Form Builder. The test items were written by the members of group which based on form 4 mathematics examination papers. Each question consists of a stem and 4 choices answer.
3.2 The Participants
Twenty-eight (28) Form 4 students from SMK Al-Mashoor were the participants of the school tryout. This group is composed of boys aging 15 years old to 16 years old.
3.3 Implementation
Twenty eight Form 4 students from SMK Al-Mashoor, Pulau Pinang were invited to RECSAM for our school try-out on 20
th April 2010. The students were divided into three groups where each group was given 30 minutes to complete the test in the ICT laboratory 1.
The students were assigned ID number for ease of identification. The main objective of this try-out is to roll out our online Mathematics Multiple Choice Test. This online test represents one use of modern technology which can enhance student experience. The students access the Mathematics Test Blog,
http://mathsf4.blogspot.com to do and complete the test (Appendix 1).
The students were asked to fill up their personal information consists of name, Identification number, ID and email address. It aimed to recognize the students’ online responses while they were doing the test and also to detect whether they have submitted their test after completed the test. Their responses can be checked via WUFOO Report Form and the responses given by the students can be seen on the screen immediately after the student pressed the submit button.
3.4 Analysis of Data
Online forms are the most efficient mechanisms for collecting data from people. In this test, questions were made using the web application WUFOO Form Builder. This application software automatically builds the database, backend and scripts needed to make collecting and understanding data easy and fast. The test formed in WUFOO Form Builder was uploaded into Mathematics Test
Blog,
http://mathsf4.blogspot.com which was created by our group’s members to be accessed by the students during the test (Appendix 1). Since the blog and the WUFOO program can be linked automatically, then the responses given by the students for each item can be retrieved easily. For the analysis of data, the database built in WUFOO was exported to Excel. From the spreadsheet, students’ data were arranged and saved to Microsoft NotePad for analysis using TAP. Results were then generated on the students’ responses which can be tallied for a summative analysis. The assessment can be used to review the tallied responses and consider results in terms of improvement of student learning.
The correct response to an item was awarded 1 mark, while an incorrect response was given 0 marks. Once we have a set of test in the Data Editor by entering our own test data we can generate the analysis by clicking Analyze (F9). Quick students’ results and quick item analysis appear. The quick results provide summary information for the students as a group, analysis on students, individual items and the test as a whole.
result and discussion
Item analysis is very important and useful to those who prepared and administered any multiple choice test. There are a lot of softwares that can be used to do the item analysis. In this project, we use the TAP software to do the item analysis. Item analysis is a process which examines student responses to individual test items in order to assess the quality of those items and of the test as a whole.
Item analysis is especially valuable in improving items which will be used again in later tests, but it can also be used to eliminate ambiguous or misleading items in a single test administration. In addition, it also provides the information on performance of the students as a group, analysis on students test as a whole and individual test items. Therefore item analysis is valuable for increasing instructors' skills in test construction, and identifying specific areas of course content which need greater emphasis or clarity.
The quality of the test as a whole is assessed by estimating its "internal consistency." The quality of individual items is assessed by comparing students' item responses to their total test scores. This report has two parts. The first part shows statistics summarizing the assessment of performance in the test as a whole. The second assesses the items which made up the exam.
4.1 Assessment of Performance in the Test as a Whole
4.1.1 Score and Confidence Interval
Table 1 shows the individual score and confidence interval for all students. The minimum score
obtained from the test is 6 (20%) and the maximum score is 19 (95%).
Table 1 also shows the mean score and standard deviation of the test. The students’ mean score is 13.8 (68.9%) with the standard deviation is around 4 i.e 3.697. In addition to expressing the variability of a population, standard deviation is commonly used to measure confidence in statistical conclusion. Standard deviation is a widely used to measure of the variability or dispersion. This means that most students (about 68 percent, assuming a normal distribution) have a score within 4 score of the mean (9.8–17.4 score) i.e one standard deviation, whereas almost all students (about 95%) have a score within 8 score of the mean (5.8-21.8) i.e 2 standard deviations. If the standard deviation were zero, then all students would be exactly got 13.8 score. Three standard deviations account for 99.7% of the students being studied, assuming the distribution is normal (bell-shaped).
Table 1 also shows that the skewness of this test is -0.449. Since the sign of the skewness statistic is negative, it shows that the distribution is negatively skewed. Skewness characterizes the degree of asymmetry of a distribution around its mean. Negative skewness indicates a distribution with an asymmetric tail extending towards more negative values. Normal distributions produce a skewness statistic of about zero. So a skewness statistic of -0.449 would be an acceptable skewness value for a normally distributed set of test scores because it is very close to zero or a negative value and indicates the possibility of a negatively skewed distribution that is, with scores bunched up on the high end of the scale. The result also shows that the kurtosis value is -0.885. The kurtosis characterizes the relative peakedness or flatness of a distribution compared to the normal distribution. Negative kurtosis indicates a relatively flat distribution. Since the kurtosis statistic had been negative, we would have known that the distribution was platykurtic (too flat).
Table 1 also shows the margin of error in getting data if the same test were to be conducted multiple times. The true-score model, which was proposed by Spearman (1904), states that an individual’s observed test score is made up of two components, a true component and an error component. The standard error of measurement, according to Dudek (1979), is an estimate of the standard deviation expected for observed scores when the true score is held constant. It is therefore an indication of how much a student’s observed test score would be expected to fluctuate either side of her true test score because of extraneous circumstances. This error estimate uncertainty means that it is not possible to say for sure which side of a cut-off point the true score of a student whose observed score is within one SEM of that cut-off point truly lies. Since SEM shown in this table report is 1.840 and we therefore say that students’ true scores will normally be within 1.840 points of their observed scores. If we take plus or minus 2 SEMs around a student’s observed score, which gives us a range we are 95% confident contains their true score. In this test, the mean is 13.786 and the standard deviation is 3.697. Table 1 shows a confidence interval of each item that contributed towards the normal distribution lie in the region respectively.
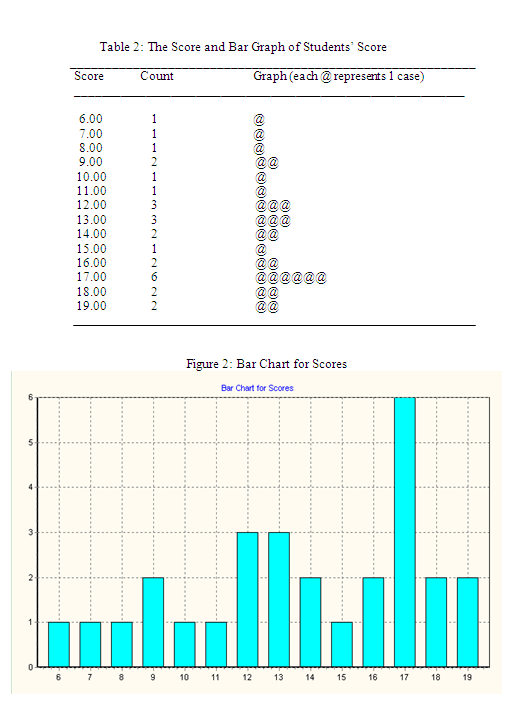
Table 2 and Figure 2 show the frequency and the bar chart for students’ scores. 6 students obtained the score of 17, 3 students obtained the score of 12 and 13 respectively, 2 students obtained the score of 2, 18 and 19 respectively and a student obtained the score of 6, 7, 8, 10, 11, and 15 respectively.
4.1.2 Score Distribution
Table 3 shows the value of z score of standard normal distribution obtained from the test. The standard normal distribution is a normal distribution with a mean of 0 and a standard deviation of 1. A z score always reflects the number of standard deviations above or below the mean a particular score is. So, a z score of 2 means the original score was 2 standard deviations above the mean. The number of students who obtained the score below the mean is 13 (46.43%) whereas 15 (53.57%) students obtained the score above the mean.

Table 4 shows the stem and leaf display of the scores. It is a method of checking test scores for normality (when rotated to the left 90° the curve should approximate a normal one). They retain most of the raw numerical data. The plot also provides a succinct look at each score. In a typical stem and leaf plot for a test score distribution, the tens place of each score is the stem and the units place of each score is the leaf. In this table for example, a student scored 16 and three students scored 13.
4.2 Assessment of Items
4.2.1 Answer Key and Number of Option Usage
Table 5 show the answer key or correct answer for each item. Each option in capital letter was
converted to numerals where A is converted to 1, B to 2, C to 3 and D to 4. It provides the information
of the key of every item immediately.
Table 6 shows the frequency and bar chart of the answer key i.e the correct answer for the test. It shows the number of keys used in this test. In the test there are 8 items with A as the key, 4 items with B as the key, 5 items with C as the key and only 2 items with D as the key.
In any multiple choice test, it is suggested that balancing the key is important to assure that each option chosen as 'correct' or key should approximately equal number or proportion of times per test. Conventional wisdom suggests that a balanced key is desirable in that it minimizes the effects of guessing. It is suggested that any serious departure from this formula would lead to higher-performing students deducing the pattern of correct answers and selecting guesses accordingly. Lower-performing students would be more disadvantaged, consistently selecting a single option for guesses, regardless of pattern.
This key used in this test is not balance since A has 9 keys whereas D has only 2 keys. Since this test contains 20 items with 4 options in each item, each key should be used 5 times such that each option is the correct option for about 25% of the items to assure has the balance key. So in this test, only B has the correct number of keys in this test.
Table 7 shows that the number of items in this test is 20 and all questions have 4 options. This analysis can give us a quick check whether there is any question that may not has enough options in the test.
4.1.2 Item Test Analysis
Table 8 shows the results generated by TAP for the test analysis. From the table, it is reflected in
the key the items which are potential problems.
These are items number 2, 4, 8, 19 and 20. In item number 2, the difficulty index is 0.2 and 6 students from the high group were correct and 4 students from the low group were correct. From this, we can infer that the item did not effectively discriminate the high group fom the low group. In item number 4, ten (10) students from the high group got the correct answer and nine (9) students from the low group, with a discrimination index of 0.2 only. Eight (8) students for the high group and eight (8) students from the low group got the correct answer in item number 8. This test item is very poor in discriminating between the high group and the low group, with a discrimination index of zero (0). Item number 19 has a discrimination index of -0.3. This has a negative value because more students from the low group (6 students) got the correct answer than the high group (3 students). Item number 19 is a bad item and should be discarded. Lastly, in item number 20, ten (10) students from the high group and ten (10) from the low group. This item has a discrimination index of 0 indicating that item number 20 is not effective in discriminating between the high group and the low group.
The rest of the test items (numbers 1, 3, 5, 6, 7, 8, 9, 10, 11, 12, 13, 14, 15, 16, 17, and 18), can be considered good items and should be retained.
Column 8 gives the point biserial correlation. Point biserial correlation a statistic that quantifies the relationship between two variables, i.e., the student either answered the test item correctly or incorrectly. The point biserial ranges from –1.00 to +1.00. A positive point biserial tells us that those scoring higher on the exam were more likely to answer the test item correctly (i.e., the item “discriminates” between high-scoring and low-scoring students). Conversely, a negative point biserial says that high scorers on the exam answered the test item incorrectly more frequently than low scorers. Compared with other items in the test, items number 2, 4, 8, 19 and 20 have low point biserial correlation of 0.19, 0.25, 0.01, -0.13 and no value, respectively. Item number 19 having a negative point biserial correlation. A negative point biserial suggests an unpleasant explanation – e.g., the item was keyed incorrectly, the item was misleading to the students, or the content of the item was inadequately taught. To make a normal distribution, point biserial correlation is adjusted. This is reflected in the last column.
Other statistics are provided in the analysis. The mean item difficulty of the test is 0.689, this means that the entire test has suitable difficulty level. Since the test has a mean item discrimination of 0.4 (this is greater than 0.2), the test is effective in discriminating the high group from the low group. Overall, the test can discriminate between high groups from low groups since it has a mean point biserial of 0.331
4.2.3 Reliability
Table 9 shows the different values of mean, standard deviation, KR-20, SEM, biserial correlation and adjusted biserial correlation if any item in the test is deleted. It helps us to increase or decrease the respective value by deleting certain item in the test.
Table 9 also shows the preferred measure of (internal consistency) reliability, Kuder-Richardson’s formula #20 or, alternatively, Cronbach’s Coefficient Alpha is computed to be 0.752 for these data. KR-21 will always be less than or equal KR-20 (equality prevails when all items have the same difficulty or differences in the indices are greater as item difficulty becomes more diverse). For almost all applications, KR-20 is the preferred index.
KR-20 ranges in theory from 0.0 to 1.0, with 0.0 indicating random number generation and 1.0 indicating perfectly consistent measurement. In rare cases, it can even go below 0.0. Therefore, a higher number is regarded as better. However, KR-20 is partially a function of test length, and tends to be higher when the test has more items. So for shorter tests like 20 or 50 items, it is unrealistic to expect KR-20 values near 1.0. In some cases, a value of 0.7 might be sufficient and accepted. Cronbach's Alpha is a measure of how well each individual item in a scale correlates with the sum of the remaining items. It measures consistency among individual items in a scale. The KR-20 values for this test were found to be higher than 0.70 indicating that this test has acceptable internal consistency. Table 4.2.5 also shows that that KR20 (0.752) improves if the item (08) is removed. The number of additional items needed to increase reliability is shown in Table 9. It is suggested in the analysis that to obtain a KR-20 reliability of .80, the test must be 1.32 times longer, for a total of 26 items of similar quality to those in the test now and to obtain a KR-20 reliability of .90, the test must be 2.96 times longer, for a total of 59 items of similar quality to those in the test now.
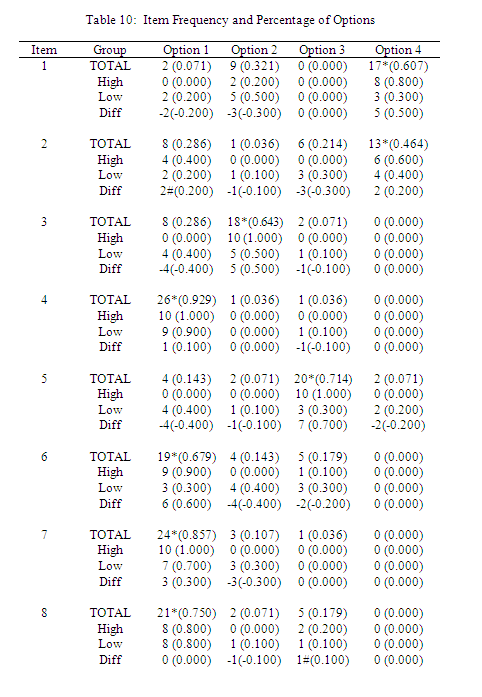
4.2.4 Option Analysis
Table 10 indicates precisely which options students selected for each item. From this table, the number and percentage of each option correctly answered by all examinees, High Group and Low Group students is shown.
The correct answer in item number 1 is option 4, eight (8) students from the high group chose this option and three (3) students from the low group, and there is a 50% difference between the high group and the low group.
In item number 2, the key is option 4, six (6) students from the high group and four (4) students from the low group got it correctly, having only a difference of 0.20. It is also indicated that option 1 discriminates better than the keyed answer.
Option number 2 is the key in item number 3 and ten (10) students from the high group and five (5) students from the low group chose this answer with a difference of 0.50.
The correct answer in item number 4 is option 1, ten (10) students from the high group chose this option and nine (9) students from the low group, and there is a 10% difference between the high group and the low group.
In item number 5, the key is option 3, ten (10) students from the high group and three (3) students from the low group obtained the correct answer, having a difference of 0.70.
Option number 1 is the key in item number 6 and nine (9) students from the high group and three (3) students from the low group chose this answer with a difference of 0.60.
The correct answer in item number 7 is option 1, ten (10) students from the high group chose this option and seven (7) students from the low group, and there is a 30% difference between the high group and the low group.
In item number 8, the key is option 1, eight (8) students from the high group and eight (8) students from the low group got it correctly, having only a difference 0. This item is not effective in discriminating between the high group and the low group.
Option number 2 is the key in item number 9 and ten (10) students from the high group and only one (1) student from the low group chose this answer with a big difference of 90%.
The correct answer in item number 10 is option 3, ten (10) students from the high group chose this option and five (5) students from the low group, and there is a 50% difference between the high group and the low group.
In item number 11, the key is option 3, nine (9) students from the high group and three (3) students from the low group obtained the correct answer, having a difference of 0.60.
Option 1 is the key in item number 12 and ten (10) students from the high group and five (5) students from the low group have this answer with a difference of 0.50.
The correct answer in item number 13 is option 1, nine (9) students from the high group chose this option and six (6) students from the low group, and there is a 30% difference between the high group and the low group.
In item number 14, the key is option 1; nine (9) students from the high group and two (2) students from the low group got it correctly, having only a difference of 0.70.
Option number 3 is the key in item number15 and nine (9) students from the high group and four (4) students from the low group chose this answer with a difference of 0.50.
The correct answer in item number16 is option 3, nine (9) students from the high group chose this option and three (3) students from the low group, and there is a 60% difference between the high group and the low group.
In item number 17, the key is option, ten (10) students from the high group and six (6) students from the low group obtained the correct answer, having a difference of 0.40.
Option number 2 is the key in item number 18 and seven (7) students from the high group and three (3) students from the low group chose this answer with a difference of 0.40.
The correct answer in item number19 is option 1, three (3) students from the high group chose this option and six (6) students from the low group, and there is a -30% difference between the high group and the low group. This item is a bad item since more students from the low group got the key that the high group.
In item number 20, the analysis indicates that all the options are correct. This is a problem item, the choices look the same (see appendix).
The above results further signified that item numbers 2, 4, 8, 19, 20 are bad items. These items should be replaced and the other items can be retained.
5.1 Conclusion
Many mathematics teachers believe that multiple choice tests are one of suitable tests to be given to the students for the topics they taught. Poorly-written multiple choice items elicit complaints from students that the questions are “picky” or confusing. But multiple choice tests can test many of the same cognitive skills that essay tests do, and, if the teacher is willing to follow the special requirements for writing multiple choice questions, the tests will be reliable and valid measures of learning.
Analyzing the responses after the test is given, it is important to perform a test-item analysis to determine the effectiveness of the questions. Most test analyzing programs provide statistics for each question regarding item difficulty, item discrimination, and frequency of response for each option. This kind of analysis gives us the information we need to improve the validity and reliability of our questions.
Practically speaking, there's no "magic number" of options we should use (Nitko, 2001). Write the number of options that make sense. It is acceptable to mix and match the number of options. Options should be relatively equal in length. A much longer or much shorter option can attract responses because they stand out visually. Make sure all options are grammatically congruent with the stem.
These analyses help to identify items that are unfair, unclear, or poor in other ways. This information can be used in a variety of ways. In the current administration of the test, we can use this information to discard items in the current administration of the test, another state-of-the-art practice (McDougall, 1997). We find students really respect the scores more when we can explain to them that certain poor items or unfair items were removed based on item analysis. For example, if we find many high-scoring students choosing a certain distracter, which cues us to rethink whether, it could be correct. Often I'll give all students who chose that distracter credit also. In future administrations of the test, reusing items is a very "cost-effective" procedure. The overall quality of the test, however, will continue to increase if we target poor items; ones that are too easy or too difficult that have zero or negative discrimination, or ones with odd response patterns to be reworked or discarded. We find it helpful when going over exams with classes or individual students to have the item analyses handy so that we can listen for reasons why those values came out as they did. Sometimes we'll even probe to get explanations as to why someone chose a distracter.
Finally, by examining the frequency of responses for the incorrect options under each question, we can determine if they are equally distracting. If no one chooses a particular option, we should rewrite it before using the question again.
5.2 Reflection
Students take tests on a computer. This allows for multiple forms of a test to be automatically generated, administered, scored, and recorded quickly and efficiently. In short, there are many advantages due to the automation the technology provides. However, there may be issues with student anxiety such as some software is restrictive in terms of letting students return to answered items, and changing responses once the students pressed the submit button in the test that we administered. They can only view one page at a time. They also still have to use paper and pencil to do the calculation. Some of the questions with diagram such as the questions involving angles, they have to draw the diagram on paper since they have to determine the connection and relate a few concepts before finding the final answer. In this case, it takes a longer time compared to paper and pencil test for this type of question. Also, students can easily see others answers and they can readily copy the same. Students should be situated far apart from each other. In this activity, teachers should always monitor their students to prevent this from happening and also to remind students on how to complete and submit their answers correctly.
Since integrating ICT to assess the students’ performance in mathematics classroom is a new type of assessment, we can still motivate the students to sit the test seriously, especially when conducting multiple choice tests.


 Kuala Lumpur Time